Most of what people know about sports analytics comes from environments drowning in data. Major League Baseball plays 162 games per team and has charted nearly every pitch for decades. The NBA plays 82. The NFL plays only 17, but compensates with density: RFID tags in every player's shoulder pads capture location ten times per second and generate more than 200 new data points on every play of every game.
Then there is college football: twelve regular-season games. Against wildly uneven opponents. With a roster that is guaranteed, by rule not by chance, to be a different roster within a few years.
Working in analytics inside a college athletic department teaches you something the textbooks tend to skip: almost every famous technique in sports analytics was developed in a big-data environment, and most of it degrades badly when you carry it into a small one. The models don't announce this. They still produce numbers. The numbers just quietly stop meaning what you think they mean.
This note is about what actually changes when the data gets small, why the naive fix, "just apply machine learning," makes things worse, and what a defensible small-data practice looks like.
Twelve games is not a sample. It's an anecdote with a schedule.
Start with the arithmetic, because it is brutal and nobody escapes it.
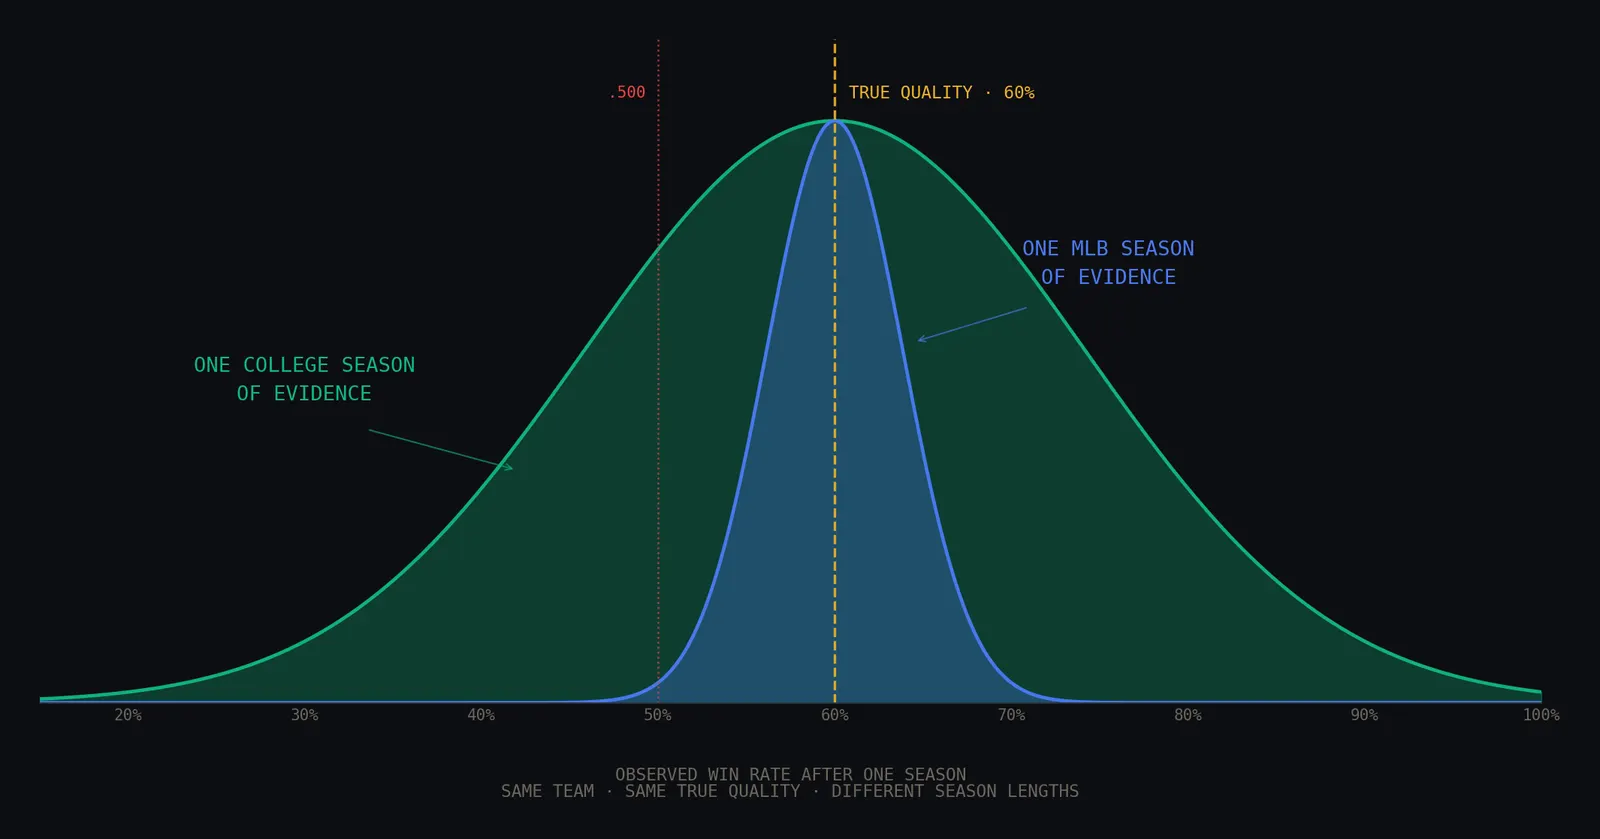
Imagine a team whose true quality is fixed: it wins exactly 60% of its games against average competition, forever. No injuries, no development, no luck in recruiting. The only randomness is the bounce of individual games.
Over 162 games, that team's observed win rate lands within about ±4 percentage points of the truth most of the time. Over 12 games, the standard deviation of its observed win rate is about 14 percentage points. Run the binomial math and a true-60% team finishes .500 or worse roughly a third of the time in a 12-game season. The same team, over an MLB-length season, finishes below .500 less than 1% of the time.
Flip it around and it gets worse: a genuinely average team, a true coin flip, wins 8 or more of its 12 games about one season in five. That's a team that is mediocre producing a record that looks like a program on the rise.
Don't take my word for it. Run the seasons yourself:
This is the whole small-data problem in one picture. The record, the most public, most discussed, most career-deciding number in the sport, is substantially a lottery ticket at n=12. Any model trained to predict or explain it inherits that noise, and any evaluation based on "did we predict the record?" is partly grading the lottery.
What one season can and cannot prove
The simulator shows the spread. Here is the same idea framed as a question every analytics staff eventually gets asked: after a full season, how sure are we about how good this team actually is?
The uncomfortable answer for college football: one season's record, taken alone, cannot reliably distinguish a conference contender from a middling team. The 95% range for a true-60% team's observed record spans roughly 32% to 88%, which, in the language of message boards, spans "fire everyone" to "extend the coach."
And this is the optimistic version. The binomial math assumes every game is an identical, independent trial against equal competition. Real college schedules are unbalanced by design: 136 FBS programs, and a non-conference slate that can be three tune-ups and a ranked opponent. So the raw record carries even less information than the interval suggests. This is exactly why serious college models lean so heavily on opponent adjustment and point-level data rather than wins: the win column is the noisiest possible summary of a season.
Here's the version of this question that decides careers: two programs, one genuinely better. How long until the win column proves it?
Sit with the default setting for a second. A true-60% program against a true-50% program, a real, meaningful gap and the difference between a bowl team and a middling one, needs on the order of 130+ games of evidence before the record separates them with 95% confidence. That is eleven college football seasons. No player's career lasts that long. Most coaching tenures don't either. For realistic quality gaps, the record cannot settle the argument within the lifetime of the thing being argued about, which is why the entire discipline comes down to extracting more evidence per game, not waiting for more games.
The sample doesn't just stay small. It dissolves.
Small n would be manageable if you could accumulate it. Baseball's early sabermetric revolution worked partly because players produce stable, comparable statistics for a decade or more. You could wait for the data.
College sports removes that option structurally. Eligibility windows cap every career. The transfer portal moves rosters wholesale: in the 2026 cycle, more than 3,350 FBS players, roughly a quarter of all FBS players, entered the portal. Coaching changes rewrite schemes, which quietly redefines what every historical data point even meant: a "deep shot" in one offense is not a "deep shot" in another.
This is the part that breaks intuition imported from pro sports. An NFL franchise churns rosters too, but the entities in its data, teams, schemes, and veteran cores, persist long enough to model. In college, "Toledo's offense" is not one thing across four seasons. It's four related but distinct systems that happen to share a stadium. Pool that history naively and you're training on a team that no longer exists.
The practical consequence: in college analytics, stationarity is the exception, not the default. Every modeling decision has to answer the question "is this pattern a property of the program, or a property of nineteen guys who just left?"
Why "just use machine learning" makes it worse
Here's the trap I think is most common, because I find it tempting myself: when the data is disappointing, reach for a more powerful model.
The logic of modern machine learning runs in exactly the wrong direction for this setting. Flexible models are data-hungry: their advantage over simple ones grows with sample size and shrinks, then inverts, as samples get small. Hand a gradient-boosted model or a neural network a few hundred team-seasons with dozens of features, and it will do what it's built to do: fit the noise beautifully. You'll see excellent backtests, because with that many degrees of freedom against that little data, the model can memorize luck. Then it meets next season, with a new roster, new scheme, and new luck, and falls apart.
Small data doesn't just weaken machine learning. It weakens validation, which is more dangerous. With twelve games a season, your holdout set is a handful of noisy outcomes, so even the safeguard that's supposed to catch overfitting is itself a small sample. It is entirely possible, routine actually, to be wrong about being right.
The mark of expertise in this field is not knowing the fanciest model. It's knowing the smallest model a dataset can honestly support, and having the discipline to stop there.
What actually works when n = 12
The good news: small-data sports analytics is not a resigned shrug. It's a real methodology with real tools; most of them are older, humbler, and better-tested than the deep learning stack. These are the six that carry the most weight in practice:
The unifying theme is that information has to come from somewhere. If it can't come from volume, it has to come from structure: smaller units of analysis, sensible priors, pooled strength across comparable teams, context that makes each observation more informative, and honest intervals where the data runs out. None of this photographs as well as a neural network. All of it survives contact with a new season better.
The data is open. The context isn't.
One objection is worth taking seriously: college football's public data ecosystem is actually excellent, and anyone who wants to work on these problems can start today, for free.
CollegeFootballData.com offers a free API covering games, drives, play-by-play, recruiting composites, and betting lines across all of FBS. The cfbfastR package (part of the open-source sportsdataverse project) wraps it into tidy, analysis-ready play-by-play. On the pro side, nflverse publishes NFL play-by-play back to 1999, which makes it the perfect control group: run the same model on both ecosystems and watch how much of its accuracy was quietly borrowed from the NFL's sample sizes.
So access to rows is not the bottleneck anymore, and pretending otherwise is a decade out of date. The bottleneck is what the rows can't contain. Public play-by-play knows a pass fell incomplete; it does not know the receiver ran the wrong route, that the quarterback checked out of the called play, or that the left tackle was playing hurt. Everyone in the country has the same open data about your team. Almost nobody has the labels that explain it.
Which is exactly where a college analytics staff should look for its edge.
The quiet advantage of being small
That edge is the counterintuitive upside, and it's the reason I find this environment more interesting than the data-rich one.
When data is scarce, proximity to the data becomes the moat. A national model, trained on every team and tuned to the average, cannot know that your left tackle played through an injury in weeks four through six, or that the new coordinator's route tree makes last year's tags misleading. Inside a program, you know. Every film session, every correction from a coach, every mislabeled play you fix is domain-specific ground truth that exists nowhere else, and in a small-data regime, a few hundred verified, context-rich labels can outweigh a public dataset a thousand times larger.
Big-data analytics rewards whoever has the most compute pointed at the same shared feeds. Small-data analytics rewards whoever is closest to the truth-generating process. That is a game a college athletic department can actually win.
The line I would draw
If a method needs thousands of games to say something reliable, it belongs to the pros; using it on a college season is decoration, not analysis.
If a method is honest about uncertainty, borrows strength intelligently, and gets more out of each game instead of demanding more games, it belongs here.
The small-data problem isn't the obstacle to doing AI in college sports. It is the actual job. The teams that internalize that will trust their numbers for the right reasons, and be appropriately suspicious of them at exactly the right times.